Python For Data Analysis-七章第二节
《Python For Data Analysis》的第七章的主要围绕如何处理缺失数据、重复数据和字符串处理以及为数据分形做一些必要的预处理展开。第七章的第二节主要讨论研究对缺失数据的处理方法。
15.1 删除重复数据(去重)
pandas的dataframe的duplicated可以判断dataframe里是否有重复的(行)数据。可以用drop_duplicates函数删除重复的数据。
- duplicated可以判断dataframe里是否存在重复的(行)数据。
import pandas as pd
import numpy as np
from random import shuffle
x = np.arange(6)
x = np.repeat(x, 16)
np.random.shuffle(x)
x = x.reshape((x.shape[0] / 3, 3))
val = x
col = list("abc")
df1 = pd.DataFrame(val, columns = col)
print "-" * 40
print df1, "# df1"
print "-" * 40
print df1.duplicated()
执行结果(数据是随机构造的,结果可能不太一样):
----------------------------------------
    a  b  c
0   5  3  0
1   2  3  0
2   0  2  5
3   3  1  5
4   1  5  3
5   0  0  5
6   3  4  5
7   0  2  0
8   3  4  3
9   0  4  1
10  3  4  5
11  3  4  1
12  2  4  4
13  4  4  4
14  0  5  3
15  4  4  2
16  3  0  1
17  3  1  5
18  1  0  1
19  2  2  5
20  0  0  2
21  5  2  5
22  1  1  1
23  0  3  3
24  2  1  5
25  2  1  4
26  2  2  5
27  2  4  3
28  0  4  5
29  1  0  4
30  2  2  3
31  1  1  5 # df1
----------------------------------------
0     False
...
9     False
10     True
11    False
...
16    False
17     True
18    False
...
25    False
26     True
27    False
...
31    False
dtype: bool
10行和6行重复,3行和17行重复,....。
- drop_duplicates函数可以删除重复的数据。
import pandas as pd
import numpy as np
from random import shuffle
x = np.arange(6)
x = np.repeat(x, 16)
np.random.shuffle(x)
x = x.reshape((x.shape[0] / 3, 3))
val = x
col = list("abc")
df1 = pd.DataFrame(val, columns = col)
print "-" * 40
print df1, "# df1"
print "-" * 40
print df1.duplicated(), "# duplicated()"
print "-" * 40
print df1.drop_duplicates(), "# drop_duplicates()"
print "-" * 40
上边的程序里的数据df1是随机数变形构造而成的,结果可能不太一样。
----------------------------------------
    a  b  c
0   0  2  3
1   0  5  3
2   4  1  3
3   2  1  0
4   1  2  5
5   0  5  0
6   4  0  2
7   2  1  3
8   5  1  1
9   2  4  2
10  0  5  3
11  4  0  2
12  5  5  3
13  3  2  0
14  2  4  1
15  2  3  3
16  1  5  1
17  4  4  2
18  4  5  1
19  4  1  1
20  3  5  4
21  0  4  4
22  5  1  3
23  3  0  3
24  2  0  5
25  0  4  3
26  1  2  4
27  2  5  5
28  4  1  2
29  3  0  4
30  0  1  5
31  5  3  0 # df1
----------------------------------------
0     False
...
9     False
10     True
11     True
12    False
...
31    False
dtype: bool # duplicated()
----------------------------------------
    a  b  c
0   0  2  3
...
9   2  4  2
12  5  5  3
...
31  5  3  0 # drop_duplicates()
----------------------------------------
数据里的第10与1行、11行与6行相同,重复了,删除。
15.2 数据转化处理
原始的DataFrame数据有很多的问题,例如精度、大小写没同意,在做进一步的数据分析前需要处理一下,本节研究数据的转化、转换(Transforming Data),在pandas里有很多的函数可以对原始数据进行初步处理,例如使用比较多的map、apply和applymap等。applymap可以作用于dataframe的每一个元素,元素级的函数。map可以作用在一维的Series、dataframe的某行或者某列上每个元素,也是,元素级的函数。而apply函数作用在行或者列上,集合级的函数。 * map函数作用于Series的每个元素,dataframe的某行或者某列也是Series,所以也可以用map函数。
import pandas as pd
import numpy as np
data = pd.DataFrame({'food': ['bacon', 'pulled pork', 'bacon',
                             'Pastrami', 'corned beef', 'Bacon',
                             'pastrami', 'honey ham', 'nova lox'],
                     'ounces': [4, 3, 12, 6, 7.5, 8, 3, 5, 6],
                     'price' :[7.8,8.3,7.5, 8.2,6.6,7.1 ,8.9,9.0,7.2]})
print "-" * 40
print data, "# data"
print "-" * 40
print "# data['food']'s type is->", type(data["food"])
print "-" * 40
print data["food"].map(str.lower), "# map on data['food'](a series)"
print "-" * 40
print data, "# data no changed"
print "-" * 40
v = data["food"].map(str.lower)
data.update(v)
print data, "# update food column"
print "-" * 40
程序执行结果:
----------------------------------------
          food  ounces  price
0        bacon     4.0    7.8
1  pulled pork     3.0    8.3
2        bacon    12.0    7.5
3     Pastrami     6.0    8.2
4  corned beef     7.5    6.6
5        Bacon     8.0    7.1
6     pastrami     3.0    8.9
7    honey ham     5.0    9.0
8     nova lox     6.0    7.2 # data
----------------------------------------
# data['food']'s type is-> <class 'pandas.core.series.Series'>
----------------------------------------
0          bacon
1    pulled pork
2          bacon
3       pastrami
4    corned beef
5          bacon
6       pastrami
7      honey ham
8       nova lox
Name: food, dtype: object # map on data['food'](a series)
----------------------------------------
          food  ounces  price
0        bacon     4.0    7.8
1  pulled pork     3.0    8.3
2        bacon    12.0    7.5
3     Pastrami     6.0    8.2
4  corned beef     7.5    6.6
5        Bacon     8.0    7.1
6     pastrami     3.0    8.9
7    honey ham     5.0    9.0
8     nova lox     6.0    7.2 # data no changed
----------------------------------------
          food  ounces  price
0        bacon     4.0    7.8
1  pulled pork     3.0    8.3
2        bacon    12.0    7.5
3     pastrami     6.0    8.2
4  corned beef     7.5    6.6
5        bacon     8.0    7.1
6     pastrami     3.0    8.9
7    honey ham     5.0    9.0
8     nova lox     6.0    7.2 # update food column
----------------------------------------
1).执行结果里的:
----------------------------------------
# data['food']'s type is-> <class 'pandas.core.series.Series'>
----------------------------------------
说明dataframe的某列或某行是一个series。
2). 执行结果里的:
----------------------------------------
          food  ounces  price
0        bacon     4.0    7.8
1  pulled pork     3.0    8.3
2        bacon    12.0    7.5
3     pastrami     6.0    8.2
4  corned beef     7.5    6.6
5        bacon     8.0    7.1
6     pastrami     3.0    8.9
7    honey ham     5.0    9.0
8     nova lox     6.0    7.2 # update food column
----------------------------------------
food列下的数据里的大写字母均改为了小写字母,原因是update函数里的新值v是由语句v = data["food"].map(str.lower)产生的,语句里的map函数将dataframe数据data的food列(是Series型数据)的每个数据里大写字母都应用了str.lower函数即变成小写字母。从v值的输出:
----------------------------------------
0          bacon
1    pulled pork
2          bacon
3       pastrami
4    corned beef
5          bacon
6       pastrami
7      honey ham
8       nova lox
Name: food, dtype: object # map on data['food'](a series)
----------------------------------------
可以看出是作用于series型数据的每个元素都使用了map指定的str.lower函数。
- update函数是inplace的函数,函数执行直接影响dataframe的数据,用新的值去更新数据。上边程序更新了food列上的数据,因为新数据仅是一个series。dataframe型数据update函数里可以用dataframe来更新多行、多列。
import pandas as pd
import numpy as np
data = pd.DataFrame({'food': ['bacon', 'pulled pork', 'bacon',
                             'Pastrami', 'corned beef', 'Bacon',
                             'pastrami', 'honey ham', 'nova lox'],
                     'ounces': [4, 3, 12, 6, 7.5, 8, 3, 5, 6],
                     'price' :[7.8,8.3,7.5, 8.2,6.6,7.1 ,8.9,9.0,7.2]})
print "-" * 40
print data, "# data"
print "-" * 40
v = pd.DataFrame([[13,8.5], [9,8.1]], columns = ['ounces', 'price'], index = [2,5])
data.update(v)
print data, "# update rows,columns"
print "-" * 40
执行结果:
----------------------------------------
          food  ounces  price
0        bacon     4.0    7.8
1  pulled pork     3.0    8.3
2        bacon    12.0    7.5
3     Pastrami     6.0    8.2
4  corned beef     7.5    6.6
5        Bacon     8.0    7.1
6     pastrami     3.0    8.9
7    honey ham     5.0    9.0
8     nova lox     6.0    7.2 # data
----------------------------------------
          food  ounces  price
0        bacon     4.0    7.8
1  pulled pork     3.0    8.3
2        bacon    13.0    8.5
3     Pastrami     6.0    8.2
4  corned beef     7.5    6.6
5        Bacon     9.0    8.1
6     pastrami     3.0    8.9
7    honey ham     5.0    9.0
8     nova lox     6.0    7.2 #  update rows,columns
----------------------------------------```
数据的2、5行的'ounces', 'price'列的数据被更新了,使用的v这个dataframe型数据。

* applymap函数可以作用于dataframe的每个元素,返回执行结果,不影响原始数据。
```python
import pandas as pd
import numpy as np
val = np.arange(24).reshape((6,4))
col = list("abcd")
ind = list("opqrst")
df1 = pd.DataFrame(val, columns = col, index = ind)
print "-" * 40
print df1, "# df1"
print "-" * 40
print df1.applymap(lambda x : 1 if x % 3 == 0 else -1)
print "-" * 40
print df1, "# df1"
print "-" * 40
执行结果:
----------------------------------------
    a   b   c   d
o   0   1   2   3
p   4   5   6   7
q   8   9  10  11
r  12  13  14  15
s  16  17  18  19
t  20  21  22  23 # df1
----------------------------------------
   a  b  c  d
o  1 -1 -1  1
p -1 -1  1 -1
q -1  1 -1 -1
r  1 -1 -1  1
s -1 -1  1 -1
t -1  1 -1 -1
----------------------------------------
    a   b   c   d
o   0   1   2   3
p   4   5   6   7
q   8   9  10  11
r  12  13  14  15
s  16  17  18  19
t  20  21  22  23 # df1
----------------------------------------
- apply作用于dataframe的行或者列即一维数组,对数组里的每个数据执行某中处理。
import pandas as pd
import numpy as np
data = pd.DataFrame({'food': ['bacon', 'pulled pork', 'bacon',
                             'Pastrami', 'corned beef', 'Bacon',
                             'pastrami', 'honey ham', 'nova lox'],
                     'ounces': [4, 3, 12, 6, 7.5, 8, 3, 5, 6],
                     'price' :[7.8,8.3,7.5, 8.2,6.6,7.1 ,8.9,9.0,7.2]})
print "-" * 40
print data, "# data"
print "-" * 40
v = pd.DataFrame([[13,8.5], [9,8.1]], columns = ['ounces', 'price'], index = [2,5])
func = lambda x : x['ounces'] * x['price']
data["cost"] = data.apply(func, axis = 1)
print data, "#  apply"
print "-" * 40
执行结果:
----------------------------------------
          food  ounces  price
0        bacon     4.0    7.8
1  pulled pork     3.0    8.3
2        bacon    12.0    7.5
3     Pastrami     6.0    8.2
4  corned beef     7.5    6.6
5        Bacon     8.0    7.1
6     pastrami     3.0    8.9
7    honey ham     5.0    9.0
8     nova lox     6.0    7.2 # data
----------------------------------------
          food  ounces  price  cost
0        bacon     4.0    7.8  31.2
1  pulled pork     3.0    8.3  24.9
2        bacon    12.0    7.5  90.0
3     Pastrami     6.0    8.2  49.2
4  corned beef     7.5    6.6  49.5
5        Bacon     8.0    7.1  56.8
6     pastrami     3.0    8.9  26.7
7    honey ham     5.0    9.0  45.0
8     nova lox     6.0    7.2  43.2 #  apply
----------------------------------------
程序实现了新增一列cost列,计算每行ounces列和price列的乘积值。
- 通过字典+map实现多对多的映射,这是书上的map函数的例子,bacon、pulled pork、honey ham都和pig猪肉有关的食品,pastrami、corned beef和cow牛肉有关的食品,nova lox属于salmon三文鱼食品。
import pandas as pd
import numpy as np
data = pd.DataFrame({'food': ['bacon', 'pulled pork', 'bacon',
                             'Pastrami', 'corned beef', 'Bacon',
                             'pastrami', 'honey ham', 'nova lox'],
                     'ounces': [4, 3, 12, 6, 7.5, 8, 3, 5, 6],
                     'price' :[7.8,8.3,7.5, 8.2,6.6,7.1 ,8.9,9.0,7.2]})
print "-" * 40
print data, "# data"
print "-" * 40
v = pd.DataFrame([[13,8.5], [9,8.1]], columns = ['ounces', 'price'], index = [2,5])
func = lambda x : x['ounces'] * x['price']
data["cost"] = data.apply(func, axis = 1)
print data, "#  apply"
print "-" * 40
v = data["food"].map(str.lower)
data.update(v)
print data, "# update food column"
meat_to_animal = { 'bacon': 'pig','pulled pork': 'pig',
                   'pastrami': 'cow','corned beef': 'cow',
                   'honey ham': 'pig','nova lox': 'salmon'}
v = data['food'].map(meat_to_animal)
print "-" * 40
print v, "# v"
print "v's type:", type(v)
print "-" * 40
data.insert(len(data.columns), "type", v)
print data
print "-" * 40
执行结果:
----------------------------------------
          food  ounces  price
0        bacon     4.0    7.8
...

8     nova lox     6.0    7.2 # data
----------------------------------------
          food  ounces  price  cost
0        bacon     4.0    7.8  31.2
...
8     nova lox     6.0    7.2  43.2 #  apply
----------------------------------------
          food  ounces  price  cost
0        bacon     4.0    7.8  31.2
...
8     nova lox     6.0    7.2  43.2 # update food column
----------------------------------------
0       pig
1       pig
2       pig
3       cow
4       cow
5       pig
6       cow
7       pig
8    salmon
Name: food, dtype: object # v
v's type: <class 'pandas.core.series.Series'>
----------------------------------------
          food  ounces  price  cost    type
0        bacon     4.0    7.8  31.2     pig
1  pulled pork     3.0    8.3  24.9     pig
2        bacon    12.0    7.5  90.0     pig
3     pastrami     6.0    8.2  49.2     cow
4  corned beef     7.5    6.6  49.5     cow
5        bacon     8.0    7.1  56.8     pig
6     pastrami     3.0    8.9  26.7     cow
7    honey ham     5.0    9.0  45.0     pig
8     nova lox     6.0    7.2  43.2  salmon
----------------------------------------
语句v = data['food'].map(meat_to_animal)的map函数里的数据是字典,对food列的数据里的各个数据进行映射找到各自所属的食物类别得到结果:
----------------------------------------
0       pig
1       pig
2       pig
3       cow
4       cow
5       pig
6       cow
7       pig
8    salmon
Name: food, dtype: object # v
----------------------------------------
而语句data.insert(len(data.columns), "type", v)里的insert函数可以在dataframe数据的某个位置len(data.columns)插入数据v,字段名为"type"。
15.3 数据的替换replace
pandas的replace函数可以进行数据的替换操作。 * 某值换成另外一个值,形参里有两个单值。
import pandas as pd
import numpy as np
data = pd.DataFrame({'food': ['bacon', 'pulled pork', 'bacon',
                             'Pastrami', 'corned beef', 'Bacon',
                             'pastrami', 'honey ham', 'nova lox'],
                     'ounces': [4, 3, 12, 6, 7.5, 8, 3, 5, 6],
                     'price' :[7.8,8.3,7.5, 8.2,6.6,7.1 ,8.9,9.0,7.2]})
print "-" * 40
print data, "# data"
print "-" * 40
print data.replace("Bacon", "bacon"), "# single to single"
print "-" * 40
执行结果:
----------------------------------------
          food  ounces  price
0        bacon     4.0    7.8
1  pulled pork     3.0    8.3
2        bacon    12.0    7.5
3     Pastrami     6.0    8.2
4  corned beef     7.5    6.6
5        Bacon     8.0    7.1
6     pastrami     3.0    8.9
7    honey ham     5.0    9.0
8     nova lox     6.0    7.2 # data
----------------------------------------
          food  ounces  price
0        bacon     4.0    7.8
1  pulled pork     3.0    8.3
2        bacon    12.0    7.5
3     Pastrami     6.0    8.2
4  corned beef     7.5    6.6
5        bacon     8.0    7.1
6     pastrami     3.0    8.9
7    honey ham     5.0    9.0
8     nova lox     6.0    7.2 # single to single
----------------------------------------
- 某些值均换成某个值,列表和一个单值。
import pandas as pd
import numpy as np
data = pd.DataFrame({'food': ['bacon', 'pulled pork', 'bacon',
                             'Pastrami', 'corned beef', 'Bacon',
                             'pastrami', 'honey ham', 'nova lox'],
                     'ounces': [4, 3, 12, 6, 7.5, 8, 3, 5, 6],
                     'price' :[7.8,8.3,7.5, 8.2,6.6,7.1 ,8.9,9.0,7.2]})
print "-" * 40
print data, "# data"
print "-" * 40
print data.replace([7.8,7.5,7.2],7.0),"# list to single"
print "-" * 40
执行结果:
----------------------------------------
          food  ounces  price
0        bacon     4.0    7.8
1  pulled pork     3.0    8.3
2        bacon    12.0    7.5
3     Pastrami     6.0    8.2
4  corned beef     7.5    6.6
5        Bacon     8.0    7.1
6     pastrami     3.0    8.9
7    honey ham     5.0    9.0
8     nova lox     6.0    7.2 # data
----------------------------------------
          food  ounces  price
0        bacon     4.0    7.0
1  pulled pork     3.0    8.3
2        bacon    12.0    7.0
3     Pastrami     6.0    8.2
4  corned beef     7.0    6.6
5        Bacon     8.0    7.1
6     pastrami     3.0    8.9
7    honey ham     5.0    9.0
8     nova lox     6.0    7.0 # list to single
----------------------------------------
- 某些值换成另外些值,常用字典反应替换时的对应关系或两个集合。
import pandas as pd
import numpy as np
data = pd.DataFrame({'food': ['bacon', 'pulled pork', 'bacon',
                             'Pastrami', 'corned beef', 'Bacon',
                             'pastrami', 'honey ham', 'nova lox'],
                     'ounces': [4, 3, 12, 6, 7.5, 8, 3, 5, 6],
                     'price' :[7.8,8.3,7.5, 8.2,6.6,7.1 ,8.9,9.0,7.2]})
print "-" * 40
print data, "# data"
print "-" * 40
print data.replace(["Bacon","Pastrami"],["bacon","pastrami"]),"# list to list"
print "-" * 40
print data.replace({"Bacon":"bacon","Pastrami": "pastrami"}), "# dict"
print "-" * 40
执行结果:
----------------------------------------
          food  ounces  price
0        bacon     4.0    7.8
1  pulled pork     3.0    8.3
2        bacon    12.0    7.5
3     Pastrami     6.0    8.2
4  corned beef     7.5    6.6
5        Bacon     8.0    7.1
6     pastrami     3.0    8.9
7    honey ham     5.0    9.0
8     nova lox     6.0    7.2 # data
----------------------------------------
          food  ounces  price
0        bacon     4.0    7.8
1  pulled pork     3.0    8.3
2        bacon    12.0    7.5
3     pastrami     6.0    8.2
4  corned beef     7.5    6.6
5        bacon     8.0    7.1
6     pastrami     3.0    8.9
7    honey ham     5.0    9.0
8     nova lox     6.0    7.2 # list to list
----------------------------------------
          food  ounces  price
0        bacon     4.0    7.8
1  pulled pork     3.0    8.3
2        bacon    12.0    7.5
3     pastrami     6.0    8.2
4  corned beef     7.5    6.6
5        bacon     8.0    7.1
6     pastrami     3.0    8.9
7    honey ham     5.0    9.0
8     nova lox     6.0    7.2 # dict
----------------------------------------
15.4 修改索引
对于dataframe有行索引index,列索引label,两者都有位置信息position,如果觉得index和label不太合适可以使用rename或者map来修改index和label。 * 修改行索引index,由于index是一个series所以可以用map函数。
import pandas as pd
import numpy as np
val = np.arange(12).reshape((3, 4))
ind = ['Ohio', 'Colorado', 'New York']
col = ['one', 'two', 'three', 'four']
data = pd.DataFrame(val, ind, col)
print "-" * 40
print data, "# data"
print "-" * 40
data.index = data.index.map(str.upper)
print data, "# map index"
print "-" * 40
执行结果:
----------------------------------------
          one  two  three  four
Ohio        0    1      2     3
Colorado    4    5      6     7
New York    8    9     10    11 # data
----------------------------------------
          one  two  three  four
OHIO        0    1      2     3
COLORADO    4    5      6     7
NEW YORK    8    9     10    11 # map index
----------------------------------------
- 下面的例子是使用rename来修改index和label。(1). 可以在rename里给出作用于每个元素的函数来修改index或lable的值。
import pandas as pd
import numpy as np
val = np.arange(12).reshape((3, 4))
ind = ['OHiO', 'COlorRado', 'New york']
col = ['one', 'two', 'three', 'four']
data = pd.DataFrame(val, ind, col)
print "-" * 40
print data, "# data"
print "-" * 40
print data.rename(index=str.title, columns=str.upper)
print "-" * 40
执行结果:
----------------------------------------
           one  two  three  four
OHiO         0    1      2     3
COlorRado    4    5      6     7
New york     8    9     10    11 # data
----------------------------------------
           ONE  TWO  THREE  FOUR
Ohio         0    1      2     3
Colorrado    4    5      6     7
New York     8    9     10    11
----------------------------------------
str.title的作用是首字母大写,str.upper函数作用是字符串变大写。(2). 也可给出一个字典给出index或者label的变化关系。
import pandas as pd
import numpy as np
val = np.arange(12).reshape((3, 4))
ind = ['Ohio', 'Colorado', 'New York']
col = ['one', 'two', 'three', 'four']
data = pd.DataFrame(val, ind, col)
print "-" * 40
print data, "# data"
print "-" * 40
data.rename(index={"Ohio": "MIT"}, columns={"one":"One", "two":"TWO"}, inplace = True)
print data, "# rename and inplace"
print "-" * 40
执行结果:
----------------------------------------
          one  two  three  four
Ohio        0    1      2     3
Colorado    4    5      6     7
New York    8    9     10    11 # data
----------------------------------------
          One  TWO  three  four
MIT         0    1      2     3
Colorado    4    5      6     7
New York    8    9     10    11 # rename and inplace
----------------------------------------
15.5 数据分箱
数据分箱(Binning)是将数据按照某种规则放入相应的箱子里,可以给每个箱子设定一定的条件(如范围、区域),然后将数据放入匹配条件的箱子里,pandas的cut函数可以完成这样的处理。也可规定每个箱子里数据个数相等来进行数据分箱操作,pandas的qcut可以实现这样的数据分箱。 * cut函数实现按不等长度区域范围对数据进行分箱操作。 举个例子,有一门课程的成绩,60分一下应该属于不及格([0, 60)这个区域)这个"箱子"里的数据,92分应属于[90, 100]这个箱子里的数据,这样对于这门课程成绩进行数据分箱处理后,后续可以统计每个箱子里的数据个数,便可知不及格和优秀的学生各有多少。
import pandas as pd
import numpy as np
# create random records
record = np.random.randint(25, 100, size=20)
print "-" * 40
print record, "# record"
# create random names
name = []
for i in range(20):
    chs = np.random.randint(ord("a"), ord("z"), size = 5)
    s = ""
    for x in chs:
        s += chr(x)
    name.append(s)
print "-" * 40
print name, "# name"
# Intervals
bins = [0, 60, 70, 80, 90, 100]
# labels
cats = list("edcba")
print "-" * 40
print cats, "# cats"
# dataframe
df = pd.DataFrame(zip(record, name), columns = ["record", "names"])
print "-" * 40
print df, "# df", df.columns
# binning
df["bins"] = pd.cut(df["record"], bins)
print "-" * 40
print df, "# df bins", df.columns
df["category"] = pd.cut(df["record"], bins, labels = cats)
print "-" * 40
print df, "# df category", df.columns
# counting
tj = pd.value_counts(df["bins"])
print "-" * 40
print tj, "# tj"
print "-" * 40
程序执行结果:
----------------------------------------
[31 97 34 74 99 82 60 86 89 72 38 71 46 91 87 52 58 70 74 85] # record
----------------------------------------
['fjhwt', 'soakm', 'choft', 'vxunm', 'eqiqe', 'gpgpl', 'djhvl', 'xiuit', 'pfrwr', 'dqtxd', 'wgeqn', 'asrcr', 'nsctf', 'basre', 'evkaa', 'yxopl', 'dihpq', 'ymahi', 'opwox', 'cwlix'] # name
----------------------------------------
['e', 'd', 'c', 'b', 'a'] # cats
----------------------------------------
    record  names
0       31  fjhwt
1       97  soakm
2       34  choft
3       74  vxunm
4       99  eqiqe
5       82  gpgpl
6       60  djhvl
7       86  xiuit
8       89  pfrwr
9       72  dqtxd
10      38  wgeqn
11      71  asrcr
12      46  nsctf
13      91  basre
14      87  evkaa
15      52  yxopl
16      58  dihpq
17      70  ymahi
18      74  opwox
19      85  cwlix # df Index([u'record', u'names'], dtype='object')
----------------------------------------
    record  names       bins
0       31  fjhwt    (0, 60]
1       97  soakm  (90, 100]
2       34  choft    (0, 60]
3       74  vxunm   (70, 80]
4       99  eqiqe  (90, 100]
5       82  gpgpl   (80, 90]
6       60  djhvl    (0, 60]
7       86  xiuit   (80, 90]
8       89  pfrwr   (80, 90]
9       72  dqtxd   (70, 80]
10      38  wgeqn    (0, 60]
11      71  asrcr   (70, 80]
12      46  nsctf    (0, 60]
13      91  basre  (90, 100]
14      87  evkaa   (80, 90]
15      52  yxopl    (0, 60]
16      58  dihpq    (0, 60]
17      70  ymahi   (60, 70]
18      74  opwox   (70, 80]
19      85  cwlix   (80, 90] # df bins Index([u'record', u'names', u'bins'], dtype='object')
----------------------------------------
    record  names       bins category
0       31  fjhwt    (0, 60]        e
1       97  soakm  (90, 100]        a
2       34  choft    (0, 60]        e
3       74  vxunm   (70, 80]        c
4       99  eqiqe  (90, 100]        a
5       82  gpgpl   (80, 90]        b
6       60  djhvl    (0, 60]        e
7       86  xiuit   (80, 90]        b
8       89  pfrwr   (80, 90]        b
9       72  dqtxd   (70, 80]        c
10      38  wgeqn    (0, 60]        e
11      71  asrcr   (70, 80]        c
12      46  nsctf    (0, 60]        e
13      91  basre  (90, 100]        a
14      87  evkaa   (80, 90]        b
15      52  yxopl    (0, 60]        e
16      58  dihpq    (0, 60]        e
17      70  ymahi   (60, 70]        d
18      74  opwox   (70, 80]        c
19      85  cwlix   (80, 90]        b # df category Index([u'record', u'names', u'bins', u'category'], dtype='object')
----------------------------------------
(0, 60]      7
(80, 90]     5
(70, 80]     4
(90, 100]    3
(60, 70]     1
Name: bins, dtype: int64 # tj
----------------------------------------
例子里语句df["bins"] = pd.cut(df["record"], bins)和bins = [0, 60, 70, 80, 90, 100]设定了5个区域作为分箱的依据,即属于[0,60)的数据放入一个箱子,属于[60, 70)放入另一个箱子,...属于[90, 100]的数据放入同一箱子。而语句tj = pd.value_counts(df["bins"])实现对每个箱子进行数据个数的统计,得到结果:
----------------------------------------
(0, 60]      7
(80, 90]     5
(70, 80]     4
(90, 100]    3
(60, 70]     1
Name: bins, dtype: int64 # tj
----------------------------------------
可知每个箱子的数据各有多少个。这个例子给出的分箱依据是不等长度区域。 * cut可以实现等区域长度分箱,方法是从数据里找到最大、最小值,然后等分成若干段区域,然后把满足区域范围的数据放入各个箱子里。
import pandas as pd
import numpy as np
record = np.random.randint(25, 100, size=20)
print "-" * 40
print record, "# record"
print "-" * 40
print "max and min of record:", max(record), min(record)
print "-" * 40
cat = pd.cut(record, 4)

print cat.categories, "# area"
print "-" * 40
print pd.value_counts(cat), "# counting"
print "-" * 40
执行结果(record数据是随机产生的,所以每次结果不太一样):
----------------------------------------
[77 41 95 71 46 40 43 40 90 40 73 72 62 75 37 46 30 44 84 82] # record
----------------------------------------
max and min of record: 95 30
----------------------------------------
IntervalIndex([(29.935, 46.25], (46.25, 62.5], (62.5, 78.75], (78.75, 95.0]]
              closed='right',
              dtype='interval[float64]') # area
----------------------------------------
(29.935, 46.25]    10
(62.5, 78.75]       5
(78.75, 95.0]       4
(46.25, 62.5]       1
dtype: int64 # counting
----------------------------------------
cut函数里的4的意思是等长度分成4个区域即[(29.935, 46.25], (46.25, 62.5], (62.5, 78.75], (78.75, 95.0]]。
* qcut函数,有的时候想每个箱子里的数据个数相同,可以用qcut函数来来实现这样的分箱操作。
import pandas as pd
import numpy as np
record = np.random.randint(25, 100, size=20)
print "****record","*" * 60
print "-" * 40
print record, "# record"
print "-" * 40
print "max and min of record:", max(record), min(record)
print "-" * 40
print "\n\n\n"
print "**** cut ","*" * 60
print "-" * 40
cat = pd.cut(record, 4)
print cat.categories, "# cut"
print "-" * 40
print pd.value_counts(cat), "# counting"
print "-" * 40
print "\n\n\n"
print "**** qcut","*" * 60
cat = pd.qcut(record, 4)
print cat.categories, "# qcut"
print "-" * 40
print pd.value_counts(cat), "# counting"
print "-" * 40
执行结果:
****record ************************************************************
----------------------------------------
[65 81 47 55 58 84 29 61 85 37 48 81 26 68 91 74 38 34 75 63] # record
----------------------------------------
max and min of record: 91 26
----------------------------------------


**** cut  ************************************************************
----------------------------------------
IntervalIndex([(25.935, 42.25], (42.25, 58.5], (58.5, 74.75], (74.75, 91.0]]
              closed='right',
              dtype='interval[float64]') # cut
----------------------------------------
(74.75, 91.0]      6
(58.5, 74.75]      5
(25.935, 42.25]    5
(42.25, 58.5]      4
dtype: int64 # counting
----------------------------------------


**** qcut ************************************************************
IntervalIndex([(25.999, 44.75], (44.75, 62.0], (62.0, 76.5], (76.5, 91.0]]
              closed='right',
              dtype='interval[float64]') # qcut
----------------------------------------
(76.5, 91.0]       5
(62.0, 76.5]       5
(44.75, 62.0]      5
(25.999, 44.75]    5
dtype: int64 # counting
----------------------------------------
cut分箱的value_counts结果为:
----------------------------------------
(74.75, 91.0]      6
(58.5, 74.75]      5
(25.935, 42.25]    5
(42.25, 58.5]      4
dtype: int64 # counting
----------------------------------------
每个区域长度相等,落入该区域里的数据的个数不等。而qcut的value_counts结果为:
----------------------------------------
(76.5, 91.0]       5
(62.0, 76.5]       5
(44.75, 62.0]      5
(25.999, 44.75]    5
dtype: int64 # counting
----------------------------------------
区域长度不等,但每个区域里的数据个数相等。
15.6 抽取随机样本
pandas的take函数、sample函数均可从dataframe数据里随机抽取出一些数据,构建抽样数据样本,take函数抽取的样本比原数据量小,而sample函数可以构造出比原数据大的数据样本。为了避免随机抽取的数据是从源数据里连续取出,可以使用random.shuffle对有序的列表或array进行乱序,也可使用使用numpy.random.permutation直接产生乱序的索引。
import pandas as pd
import numpy as np
import random
li = range(12,20)
print li, "# li"
random.shuffle(li)
print li, "# li shuffle"
arr = np.arange(12,20)
print arr, "# arr"
ind = np.random.permutation(arr)
print ind, "# ind"
执行结果:
[12, 13, 14, 15, 16, 17, 18, 19] # li
[18, 16, 14, 15, 13, 12, 19, 17] # li shuffle
[12 13 14 15 16 17 18 19] # arr
[19 12 16 15 17 18 13 14] # ind
- take函数从dataframe提取部分数据,和iloc的作用相似。
import pandas as pd
import numpy as np
import random
data = pd.DataFrame({'food': ['bacon', 'pulled pork', 'bacon',
                             'Pastrami', 'corned beef', 'Bacon',
                             'pastrami', 'honey ham', 'nova lox'],
                     'ounces': [4, 3, 12, 6, 7.5, 8, 3, 5, 6],
                     'price' :[7.8,8.3,7.5, 8.2,6.6,7.1 ,8.9,9.0,7.2]})
print "-" * 40
print data, "# data"
sampler = np.random.permutation([1,2,6,7])
print "-" * 40
print data.take(sampler), "# take"
print "-" * 40
print data.iloc[sampler], "# iloc"
print "-" * 40
执行结果:
----------------------------------------
          food  ounces  price
0        bacon     4.0    7.8
1  pulled pork     3.0    8.3
2        bacon    12.0    7.5
3     Pastrami     6.0    8.2
4  corned beef     7.5    6.6
5        Bacon     8.0    7.1
6     pastrami     3.0    8.9
7    honey ham     5.0    9.0
8     nova lox     6.0    7.2 # data
----------------------------------------
          food  ounces  price
2        bacon    12.0    7.5
7    honey ham     5.0    9.0
6     pastrami     3.0    8.9
1  pulled pork     3.0    8.3 # take
----------------------------------------
          food  ounces  price
2        bacon    12.0    7.5
7    honey ham     5.0    9.0
6     pastrami     3.0    8.9
1  pulled pork     3.0    8.3 # iloc
----------------------------------------
- sample函数可以随机抽取任意个数据。
import pandas as pd
import numpy as np
import random
data = pd.DataFrame({'food': ['bacon', 'pulled pork', 'bacon',
                             'Pastrami', 'corned beef', 'Bacon',
                             'pastrami', 'honey ham', 'nova lox'],
                     'ounces': [4, 3, 12, 6, 7.5, 8, 3, 5, 6],
                     'price' :[7.8,8.3,7.5, 8.2,6.6,7.1 ,8.9,9.0,7.2]})
print "-" * 40
print data, "# data"
sampler = np.random.permutation([1,2,6,7])
print "-" * 40
print data.take(sampler), "# take"
print "-" * 40
print data.iloc[sampler], "# iloc"
print "-" * 40
print data.sample(n = 4)
print "-" * 40
执行结果:
----------------------------------------
          food  ounces  price
0        bacon     4.0    7.8
1  pulled pork     3.0    8.3
2        bacon    12.0    7.5
3     Pastrami     6.0    8.2
4  corned beef     7.5    6.6
5        Bacon     8.0    7.1
6     pastrami     3.0    8.9
7    honey ham     5.0    9.0
8     nova lox     6.0    7.2 # data
----------------------------------------
          food  ounces  price
2        bacon    12.0    7.5
1  pulled pork     3.0    8.3
6     pastrami     3.0    8.9
7    honey ham     5.0    9.0 # take
----------------------------------------
          food  ounces  price
2        bacon    12.0    7.5
1  pulled pork     3.0    8.3
6     pastrami     3.0    8.9
7    honey ham     5.0    9.0 # iloc
----------------------------------------
          food  ounces  price
2        bacon    12.0    7.5
8     nova lox     6.0    7.2
1  pulled pork     3.0    8.3
6     pastrami     3.0    8.9
----------------------------------------
从结果对比可以看出sample函数是随机提取4行数据,而不是像take那样抽取的是指定序列的行,当sample指定的行数大于数据本身的长度时需要使用’inplace=True‘。
import pandas as pd
import numpy as np
import random
data = pd.DataFrame({'food': ['bacon', 'pulled pork', 'bacon',
                             'Pastrami', 'corned beef', 'Bacon',
                             'pastrami', 'honey ham', 'nova lox'],
                     'ounces': [4, 3, 12, 6, 7.5, 8, 3, 5, 6],
                     'price' :[7.8,8.3,7.5, 8.2,6.6,7.1 ,8.9,9.0,7.2]})
print "-" * 40
print data, "# data"
sampler = np.random.permutation([1,2,6,7])
print "-" * 40
print data.sample(n = 4), "# sample < len"
print "-" * 40
print data.sample(n = 16, replace = True), "# sample > len"
print "-" * 40
执行结果:
----------------------------------------
          food  ounces  price
0        bacon     4.0    7.8
1  pulled pork     3.0    8.3
2        bacon    12.0    7.5
3     Pastrami     6.0    8.2
4  corned beef     7.5    6.6
5        Bacon     8.0    7.1
6     pastrami     3.0    8.9
7    honey ham     5.0    9.0
8     nova lox     6.0    7.2 # data
----------------------------------------
          food  ounces  price
3     Pastrami     6.0    8.2
1  pulled pork     3.0    8.3
6     pastrami     3.0    8.9
8     nova lox     6.0    7.2 # sample < len
----------------------------------------
          food  ounces  price
4  corned beef     7.5    6.6
8     nova lox     6.0    7.2
6     pastrami     3.0    8.9
7    honey ham     5.0    9.0
5        Bacon     8.0    7.1
1  pulled pork     3.0    8.3
4  corned beef     7.5    6.6
3     Pastrami     6.0    8.2
2        bacon    12.0    7.5
6     pastrami     3.0    8.9
5        Bacon     8.0    7.1
1  pulled pork     3.0    8.3
3     Pastrami     6.0    8.2
1  pulled pork     3.0    8.3
7    honey ham     5.0    9.0
1  pulled pork     3.0    8.3 # sample > len
----------------------------------------
15.7 指标或虚变量Dummy Variables
下面以经典调查数据[the Population Survey of Income Dynamics and the Current Population Survey(https://users.nber.org/~rdehejia/data/nswdata2.html)为例,来说明指标或虚变量的意义,其数据可以从https://vincentarelbundock.github.io/Rdatasets/datasets.html网站下载cpc3.csv文件是数据文件,而doc文件则是对数据文件各个字段的说明,这个数据统计文件是美国针对部分公民做的一下调查,看一个美国公民年收入和其种族、学历、婚姻之间是否有必然的联系和影响。
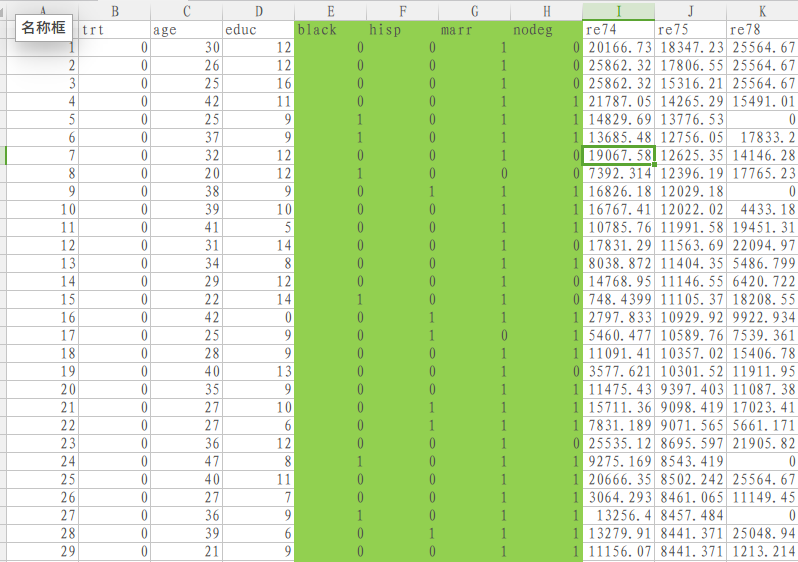
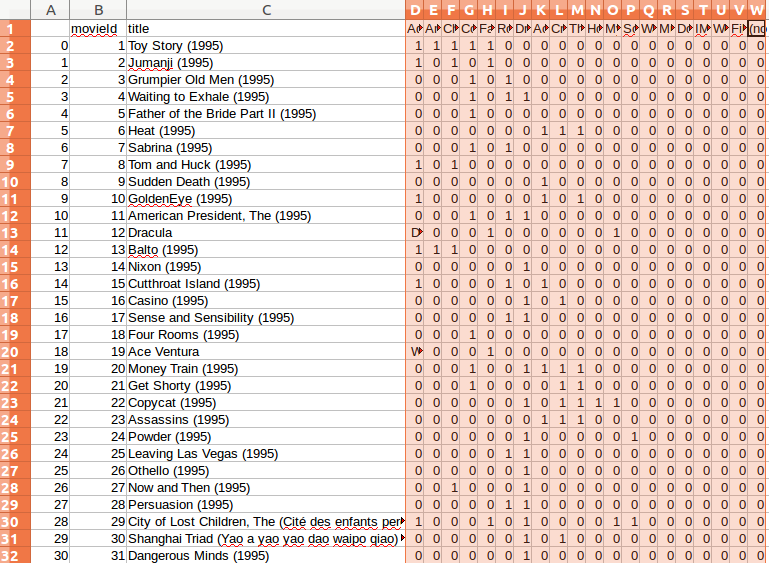
我们假设调查时请被调查者从是否已婚、是否为黑人、是否有本科学历和是否是西班牙裔四个选项里选择一下被调查人的基本情况,为了降低数据量,不可能设计表格让被调查者来选,而是写这四项里某项或某几项,这样调查汇总数据总量会比较少,而研究者在得到调查数据后,可以用一个大的数据表或excel文件,在数据文件里列出这四项,如果某被调查者说明自己是黑人且已婚那么在其数据行的black和married下标志为1,而非西班牙裔、非本科学历则其下设置为0,这样的数据处理方式可以称之为虚变量Dummy Variables,而设计的这四项选择数据就是Computing Indicator即统计计算的标量。总之这样的设计可以用数字0和1来代表某一调查属性的真或者假,降低数据的存储更便于数据的统计分析,如果还是理解不了,那么就看看上图就能明白,实际是数据的一种变换形式,其目的是为了便于统计分析。 其特征是数据有k个分类(k distinct values)。上边我们看到的数据是处理后的数据,那么原数据网站并未给出,我们可以使用本书给的另一个有关美国电影的统计数据来最终变成上边这个图片里样子。电影统计数据可以从其官网https://grouplens.org/datasets/movielens/下载较小的数据文件ml-latest-small.zip,使用其中的movies.csv文件。
movieId,title,genres
1,Toy Story (1995),Adventure|Animation|Children|Comedy|Fantasy
2,Jumanji (1995),Adventure|Children|Fantasy
3,Grumpier Old Men (1995),Comedy|Romance
4,Waiting to Exhale (1995),Comedy|Drama|Romance
5,Father of the Bride Part II (1995),Comedy
6,Heat (1995),Action|Crime|Thriller
7,Sabrina (1995),Comedy|Romance
8,Tom and Huck (1995),Adventure|Children
9,Sudden Death (1995),Action
10,GoldenEye (1995),Action|Adventure|Thriller
11,"American President, The (1995)",Comedy|Drama|Romance
12,Dracula: Dead and Loving It (1995),Comedy|Horror
13,Balto (1995),Adventure|Animation|Children
14,Nixon (1995),Drama
15,Cutthroat Island (1995),Action|Adventure|Romance
这样的一个文件,第一列是电影编号,第二列是电影名和出产年代,第三列是电影的类型,就是这第三列和上边的统计收入的数据很像,一个电影的类型可能属于多种类型,但电影的类型是有限的即有k可显著特征值,必然属于这k个电影分类的某一种或几种,那么这第三列数据就可以设计出k个计算标量,然后对应每条电影统计记录,在相应的电影分类下设置1代表该电影是这个类型的电影,而设置0则表示该电影不属于这类电影,最终会和上图的有关婚姻、黑人、西班牙裔以及有本科学历数据项相似,有了这样的数据统计就会方便很多。 怎么处理这个原始的文件呢?先从大的方面来处理,先读出3列数据吧,然后再对第三列进行特殊处理即找到文件里电影分类个数,然后对某电影的分类设置1,不属于的设置0。思路大致就是这样。
1). 通过pandas的read_table读取movies.csv文件里的数据到dataframe数据里,数据里的每行记录的字段用逗号间隔,所以可以指定read_table函数的seq为',',而数据的第一行是数据的字段信息,所以需要使用header参数,设置header=0即数据字段信息只在第0行。
import pandas as pd
import numpy as np
movies = pd.read_table('movies.csv', sep=',', header=0, engine='python')
print "-" * 40
print movies[:5], "# movies first 5"
print "-" * 40
2). 数据通过read_table读入到dataframe类型数据变量movies里,movies的genres字段下是电影的类型。需要获得电影的种类,可以使用unique函数获得数据文件里的电影分类并存储在genres变量里(语句genres = pd.unique(all_genres)的genres是series变量)。
all_genres = []
for x in movies.genres:
    all_genres.extend(x.split('|'))
genres = pd.unique(all_genres)
print genres, "# genres", "has", len(genres), "cats"
print "-" * 40
3). 在获得了电影种类个数k后便可构造一个n x k的全0矩阵了(对应程序的zero_matrix)并构建dataframe数据(对应程序里的dummies),如上图有颜色的几列。
zero_matrix = np.zeros((len(movies), len(genres)))
dummies = pd.DataFrame(zero_matrix, columns=genres)
print dummies, "# dummies"
4). 有了n行k列的dataframe,可以遍历movies来对应设置这k列(电影类型)下为1或为0的工作了。怎样快速的给某行的电影数据在对应的电影类型下设置为1呢?可以先得到该电影的分类,然后依据该电影的分类gen.split('|'),再通过get_indexer函数找到在该电影分类在所有电影分类集合genres的索引indices,最后对全0的dummies数据indices位置上设值1即完成该电影分类字段下设置为1的操作。
'''
# test the first record and find position
gen = movies.genres[0]
print gen, "# gen"
print "-" * 40
print gen.split('|'), "# gen.split('|')"
print "-" * 40
print dummies.columns.get_indexer(gen.split('|')),"# get"
'''
for i, gen in enumerate(movies.genres):
    indices = dummies.columns.get_indexer(gen.split('|'))
    dummies.iloc[i, indices] = 1
print dummies.iloc[:5, :5]
5).最后拼接movies和dummies数据,并输出到.csv文件。
df = pd.concat([movies.iloc[:,:2] ,dummies], axis = 1)#.iloc[:5, :5]
df.to_csv("out.csv")
结果:
 需要说明的是数据文件里有一些坏数据,例如11行电影名字里有逗号,那么
movies = pd.read_table('movies.csv', sep=',', header=0, engine='python')里的seq用逗号分割这条记录时会多产生一列,处理办法,可以将每行第一个和最后一个逗号换成两个冒号::用冒号分割就屏蔽了电影名字里的逗号问题,这里就具体去实现了,但总体来说完成了实现第一张图的处理需求。
最后给出完成的程序如下,同时movies.csv和本程序需要在同一目录下:
import pandas as pd
import numpy as np
movies = pd.read_table('movies.csv', sep=',', header=0, engine='python')
print "-" * 40
print movies[:5], "# movies first 5"
print "-" * 40

all_genres = []
for x in movies.genres:
    all_genres.extend(x.split('|'))
genres = pd.unique(all_genres)
print genres, "# genres", "has", len(genres), "# cats"
print "-" * 40

zero_matrix = np.zeros((len(movies), len(genres)))
dummies = pd.DataFrame(zero_matrix, columns=genres)
#print dummies, "# dummies"
#print "-" * 40

'''
# test the first record and find position
gen = movies.genres[0]
print gen, "# gen"
print "-" * 40
print gen.split('|'), "# gen.split('|')"
print "-" * 40
print dummies.columns.get_indexer(gen.split('|')),"# get"
'''
for i, gen in enumerate(movies.genres):
    indices = dummies.columns.get_indexer(gen.split('|'))
    dummies.iloc[i, indices] = 1
print dummies.iloc[:5, :5]
print "-" * 40
df = pd.concat([movies.iloc[:,:2] ,dummies], axis = 1)#.iloc[:5, :5]
print df.iloc[:10, :5]
print "-" * 40
df.to_csv("out.csv")
执行结果:
----------------------------------------
   movieId                     ...                                                            genres
0        1                     ...                       Adventure|Animation|Children|Comedy|Fantasy
1        2                     ...                                        Adventure|Children|Fantasy
2        3                     ...                                                    Comedy|Romance
3        4                     ...                                              Comedy|Drama|Romance
4        5                     ...                                                            Comedy

[5 rows x 3 columns] # movies first 5
----------------------------------------
['Adventure' 'Animation' 'Children' 'Comedy' 'Fantasy' 'Romance' 'Drama'
 'Action' 'Crime' 'Thriller' 'Horror' 'Mystery' 'Sci-Fi' 'War' 'Musical'
 'Documentary' 'IMAX' 'Western' 'Film-Noir' '(no genres listed)'] # genres has 20 # cats
----------------------------------------
   Adventure  Animation  Children  Comedy  Fantasy
0        1.0        1.0       1.0     1.0      1.0
1        1.0        0.0       1.0     0.0      1.0
2        0.0        0.0       0.0     1.0      0.0
3        0.0        0.0       0.0     1.0      0.0
4        0.0        0.0       0.0     1.0      0.0
----------------------------------------
   movieId                               title  Adventure  Animation  Children
0        1                    Toy Story (1995)        1.0        1.0       1.0
1        2                      Jumanji (1995)        1.0        0.0       1.0
2        3             Grumpier Old Men (1995)        0.0        0.0       0.0
3        4            Waiting to Exhale (1995)        0.0        0.0       0.0
4        5  Father of the Bride Part II (1995)        0.0        0.0       0.0
5        6                         Heat (1995)        0.0        0.0       0.0
6        7                      Sabrina (1995)        0.0        0.0       0.0
7        8                 Tom and Huck (1995)        1.0        0.0       1.0
8        9                 Sudden Death (1995)        0.0        0.0       0.0
9       10                    GoldenEye (1995)        1.0        0.0       0.0
----------------------------------------
得到
----------------------------------------
   Adventure  Animation  Children
0        1.0        1.0       1.0
1        1.0        0.0       1.0
2        0.0        0.0       0.0
3        0.0        0.0       0.0
4        0.0        0.0       0.0
----------------------------------------
这几列是本节的主要目标和研究即虚变量。